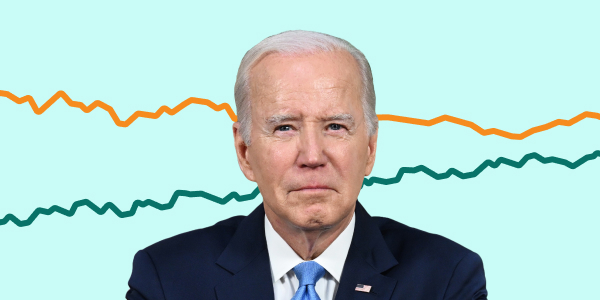
Biden vs. Trump vs. RFK Jr.
Feb 22, 2025
Trump
42.6%
Biden
38.6%
Kennedy
8.7%
Estimate
95% of polls fall in this range
A bit of background... As voters have soured on Joe Biden and Donald Trump over the past four years, many have wondered whether third-party candidates will run stronger than in previous elections. Robert F. Kennedy Jr.’s campaign introduces a compelling three-way contest against incumbent President Joe Biden and former President Donald Trump. This unique configuration tests the waters of American political allegiance, as voters consider a broader spectrum of options for the country's leadership, similar to in 2016.
246 polls
Latest Poll: Wed, Nov 27, 8:05 AM EST
Field Dates | Sample | Pollster | Results | Topline |
|---|---|---|---|---|
| Jul 20 – 23 | 1,113 RV | YouGov/Yahoo News | 43.0%Trump 41.0%Biden 5.0%Kennedy | +2 Trump |
| Jul 20 – 22 | 982 LV | Echelon Insights | 43.0%Trump 42.0%Biden 10.0%Kennedy | +1 Trump |
| Jul 20 – 22 | 1,257 RV | Quinnipiac Universit... | 44.0%Trump 39.0%Biden 8.0%Kennedy | +5 Trump |
| Jul 20 – 22 | 2,753 RV | HarrisX/Forbes | 46.0%Trump 37.0%Biden 15.0%Kennedy | +9 Trump |
| Jul 20 – 22 | 780 RV | Florida Atlantic Uni... | 43.0%Trump 35.5%Biden 11.2%Kennedy | +8 Trump |
| Jul 19 – 22 | 1,000 LV | Rasmussen Reports | 48.0%Trump 37.0%Biden 8.0%Kennedy | +11 Trump |
| Jul 15 – 22 | 1,030 RV | The Bullfinch Group/... | 40.0%Trump 35.0%Biden 11.0%Kennedy | +5 Trump |
| Jul 17 | 992 RV | Ipsos/Reuters | 40.0%Trump 39.0%Biden 11.0%Kennedy | +1 Trump |
| Jul 16 – 17 | 1,000 RV | Emerson College Poll... | 43.8%Trump 37.8%Biden 6.6%Kennedy | +6 Trump |
| Jul 14 – 17 | 1,398 RV | YouGov/The Economist | 43.0%Trump 41.0%Biden 4.0%Kennedy | +2 Trump |
+ More Polls
The polling bias for the 2016 and 2020 Presidential elections is based on analysis from the American Association of Public Opinion Research (AAPOR) comparing actual results to national polls. For the 2018 and 2022 elections, bias was measured by comparing FiveThirtyEight's Generic Ballot polling average with the adjusted US House National Popular vote, using data from the UVA Center for Politics (2018) and DecisionDeskHQ (2022).


