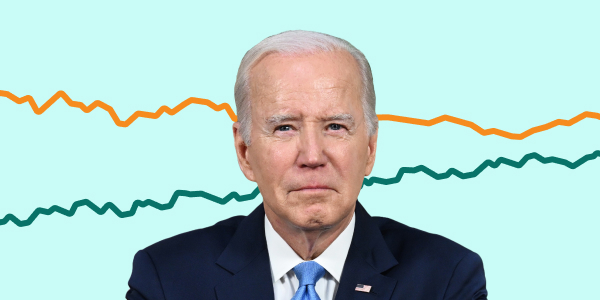
Biden vs. Trump
Feb 22, 2025
Trump
46.6%
Biden
43.3%
Estimate
95% of polls fall in this range
Polling average unskewer
Our 'unskewer' is a way to adjust for whatever bias you think is reflected in the polls. For example, if a Republican candidate is at 44% and a Democrat is at 42%, slide our 'unskewer' 2 point to the left and it will reduce the Republican candidate's margin by 2 points.
Rep. +3.3
Original Avg.
Rep. +3.3
Adjusted Avg.
Reset
A bit of background... The 2024 national popular vote polling average between President Joe Biden and former President Donald Trump is a significant indicator of the political landscape as the United States gears up for another presidential election. This matchup is a rematch of the 2020 Presidential Election, with Biden seeking to continue his leadership and Trump aiming to reclaim the presidency. Biden defeated Trump in 2020, flipping key states such as Arizona, Georgia, Wisconsin, Pennsylvania, and Michigan.
825 polls
Latest Poll: Wed, Nov 27, 8:05 AM EST
Field Dates | Sample | Pollster | Results | Topline |
|---|---|---|---|---|
| Jul 20 – 23 | 1,115 RV | YouGov/Yahoo News | 45.0%Trump 45.0%Biden | TIE |
| Jul 20 – 22 | 1,257 RV | Quinnipiac Universit... | 48.0%Trump 45.0%Biden | +3 Trump |
| Jul 20 – 22 | 982 LV | Echelon Insights | 49.0%Biden 48.0%Trump | +1 Biden |
| Jul 20 – 22 | 2,753 RV | HarrisX/Forbes | 53.0%Trump 47.0%Biden | +6 Trump |
| Jul 20 – 22 | 780 RV | Florida Atlantic Uni... | 48.1%Trump 39.8%Biden | +8 Trump |
| Jul 19 – 22 | 1,000 LV | Rasmussen Reports | 50.0%Trump 42.0%Biden | +8 Trump |
| Jul 15 – 22 | 1,030 RV | The Bullfinch Group/... | 46.0%Trump 41.0%Biden | +5 Trump |
| Jul 17 – 19 | 2,247 RV | YouGov/CBS News | 52.0%Trump 47.0%Biden | +5 Trump |
| Jul 18 | 800 LV | SoCal Research/On Po... | 51.0%Trump 45.0%Biden | +6 Trump |
| Jul 16 – 18 | 2,402 LV | 3W Insights/WelcomeP... | 47.0%Trump 43.0%Biden | +4 Trump |
+ More Polls
The polling bias for the 2016 and 2020 Presidential elections is based on analysis from the American Association of Public Opinion Research (AAPOR) comparing actual results to national polls. For the 2018 and 2022 elections, bias was measured by comparing FiveThirtyEight's Generic Ballot polling average with the adjusted US House National Popular vote, using data from the UVA Center for Politics (2018) and DecisionDeskHQ (2022).